[ 학습목표 ]
그래프의 가독성을 높이고 보기좋게 꾸미기 위해 색상, 마커, 선의 스타일을 설정할 수 있다
라이브러리 임포트
import matplotlib.pyplot as plt
한글폰트 사용
# 폰트 확인하기
import matplotlib.font_manager as fm
[f.name for f in fm.fontManager.ttflist if 'Malgun' in f.name]
['Malgun Gothic', 'Malgun Gothic', 'Malgun Gothic']# 한글폰트 지정
plt.rcParams['font.family'] = 'Malgun Gothic'
# 한글폰트 사용 시 -기호 깨지는 문제 해결
plt.rcParams['axes.unicode_minus']=False# 그래프로 확인
x = ['봄','여름','가을','겨울']
y = [19,30,15,-10]
# 그래프 그리기
plt.plot(x,y)[<matplotlib.lines.Line2D at 0x216eceb5e80>]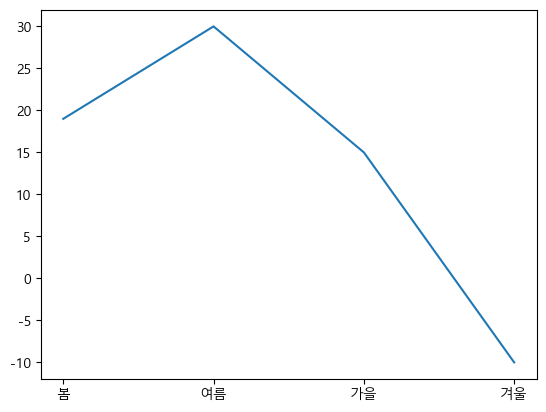
색상, 마커, 선
색상
- color=색상
- 색상 이름을 사용한다. https://matplotlib.org/2.0.2/examples/color/named_colors.html
- 자주 사용되는 색깔은 약자를 사용할 수 있다.(blue:b, green:g, red:r, cyan:c, magenta:m, yellow:y, black:k, white:w)
- hex code를 사용할 수 있다.
x = ['봄','여름','가을','겨울']
y = [19,30,15,-10]

# 색상이름
plt.plot(x,y,color='skyblue')
[<matplotlib.lines.Line2D at 0x216ed7c8d00>]
# 색상이름 약자(blue:b, green:g, red:r, cyan:c, magenta:m, yellow:y, black:k, white:w)
plt.plot(x,y,color='r')
[<matplotlib.lines.Line2D at 0x216ecfa4760>]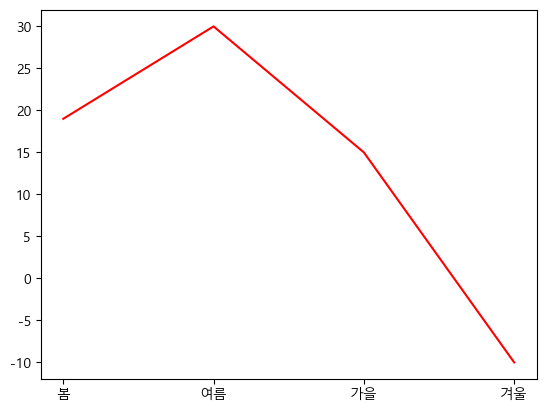
# 색상코드
plt.plot(x,y,color='#A566FF')
[<matplotlib.lines.Line2D at 0x216ed0188b0>]
마커
- marker : 마커종류 (* . , o v ^ < > 1 2 3 4 s p * h H + x D d)
- markersize, ms : 마커사이즈
- markeredgecolor, mec : 마커 선 색깔
- markeredgewidth, mew : 마커 선 굵기
- markerfacecolor, mfc : 마커 내부 색깔
plt.plot(x,y,color='#A566FF', marker='D', ms='10', mec='b', mew='3', mfc='y')[<matplotlib.lines.Line2D at 0x216ed7ed640>]
선
- linestyle, ls : 선스타일
'-' solid line style
'--' dashed line style
'-.' dash-dot line style
':' dotted line style - linewidth, lw : 선 굵기
plt.plot(x,y,color='#A566FF', marker='D', ms='10', mec='b', mew='3', mfc='y'
        ,ls=':', lw=3)
[<matplotlib.lines.Line2D at 0x216ed8256d0>]
[색상][마커][선]
- [color][marker][line]
색상
plt.plot(x,y,'k')[<matplotlib.lines.Line2D at 0x216ed95f430>]
마커
plt.plot(x,y,'o')[<matplotlib.lines.Line2D at 0x216ed8f7fd0>]
선
plt.plot(x,y,'--')[<matplotlib.lines.Line2D at 0x216ee9790a0>]
색상,마커
plt.plot(x,y,'ro')[<matplotlib.lines.Line2D at 0x216ee9ef2e0>]
색상,선
plt.plot(x,y,'y--')[<matplotlib.lines.Line2D at 0x216eea58c40>]
마커, 선
plt.plot(x,y,'*:')[<matplotlib.lines.Line2D at 0x216eeada160>]
색상,마커,선
plt.plot(x,y,'g*:', ms=10, mec='r', mfc='k', lw=3)[<matplotlib.lines.Line2D at 0x216eeb41eb0>]
'파이썬 > 시각화 matplot' 카테고리의 다른 글
| pyplot으로 서브플롯 그리기 plt.pyplot (0) | 2023.05.15 |
|---|---|
| 여러개의 그래프와 범례 (0) | 2023.05.15 |
| 축의 범위와 눈금 지정 (0) | 2023.05.15 |
| 제목, 축 레이블, 그리드 (0) | 2023.05.15 |
| 목적에 따른 여러가지 그래프 (0) | 2023.05.15 |


